NFL Machine Learning Picks: Super Bowl 57

Let’s start with my personal record picking Super Bowl ATS winners in the last 16 years. I’m 14-2 and last year’s half point cost me my second loss. Only if the extra point would’ve gone in or if OBJ would’ve played the second half… This year has been a bit rough. Too many weeks breaking even or losing and only one week where we cleaned up. The Super Bowl is different, we have more time to prepare and think it through. 


Kansas City +1.5


The biggest variable is Mahomes high ankle sprain and if he’ll be able to survive the whole game without limping. Playing against the outlier #1 team in sacks who hurt two QBs in the last game, the likelihood of him getting injured increases significantly. 


Assuming he can play and run around for the whole game, even if it’s at 75%, here’s my analysis. Otherwise, if he gets injured, it’s over just like the 49ers.


Offense and Defense

Both teams scored an average of 27.8 points per game and are ranked 1st (KC) and 3rd (PHI) in the league. The Eagles did it mostly on the ground and the Chiefs with the pass. The Chiefs lead the league in passing DVOA while the Eagles lead the league in running. 


The biggest matchup is KC’s #1 passing offense against the #1 passing defense. The Chiefs could decide to build a bigger impacting ground game for this game as the Eagles rushing defense is below average. Feed Pacheco and McKinnon and this #9 rushing offense could find success.


The Eagles on the other hand will be able to move the chains on the ground. Only with good preparation will KC be able to stop the run game. Now a lot of the Eagles run game comes from Hurts and he will be facing the 2nd best pass rush in the league. The Eagles have great wide receivers that can exploit the Chiefs secondary if Hurts has enough time to throw the ball. 


The advantage of the passing game is a security blanket if the team is down. In that case, there’s an advantage for KC. On the other hand, if KC can’t find receivers or are getting rushed, then we’re back in 2019 when the Bucs stopped Mahomes by running through the offensive line. This year, the Chiefs were 5th in the league in allowing the least sacks while the Eagles were 21st. That could be trouble for the Eagles and a potential relief of stopping the mad rush of the Eagles.


Strength of Schedule

It is important to note that the Eagles had one of the easiest schedules in the league. It was predicted at the beginning of the season and after the season they remained with one of the lowest strength of schedule in the league. The Chiefs were predicted to have the 2nd toughest schedule and finished 8th. They have also had a much tougher run for the playoffs after beating the Jaguars and the Bengals, than the Giants and a team with a 5th string QB.


Quarterbacks

The quarterback being the most important position, I’m a fan of backing the team with the better QB. But who’s better, Mahomes or Hurts? Ok, that shouldn’t be a question. Mahomes numbers for his first 5 five years in the league are breaking all kinds of records. Mahomes needs this ring so the conversation about him being the potential new goat (long way to go though) solidifies. 


Hurts time will come, especially with that receiving squad, but they might need another shot at it. His passing yards aren’t impressive. He threw for 3700 yards, 22 TD and 6 INT, rarely throwing over 300 and a few times under 200. Experience counts and there’s a chance he makes too many mistakes like last year when they lost against the Bucs, they were down 31-0 at some point and he threw 2 INTs.


Coaches

Both great coaches with different styles. Syrianni is more aggressive and risk taking while Reid game plans to keep the score close and end it when needed. This is Syrianni’s 3rd game in the playoffs as a head coach, he’s 2-1. Reid is 20-16 in the playoffs and 10 of those wins with the Chiefs. His trademark is preparation and has a ridiculous 28-4 record after a bye week.


Machine Learning Models

I understand that it is a bit of black box even for me. I know the tools being used and ingredients to make the outputs, but why precisely do my models like the Chiefs over the Eagles is hard to tell. Could be that the differences in some offense and defense metrics benefit the Chiefs more than the Eagles. It could also be because they beat harder teams. Could also be that the differences in point (line), after an outlier effect minimization, also benefits the Chiefs. 


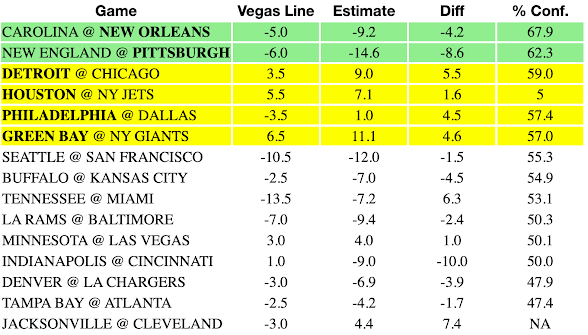
Whatever the reason, all my models point at the Chiefs and some have them winning by 10! On a weighted average, as the output below shows, I predict they win anywhere between 3 and 7 points.


NFL Machine Learning Picks: Conference Championship

 Final Say

Divisional playoffs have arrived and we’re down to 4 teams. Each of the games' geeky stat comparison can be found here for the NFC and the AFC Divisional Games.


First let me review last week. The Good: SF narrative with Prescott’s fall was accurate. CIN was money but chickened out bc of the offensive line. Should’ve checked the weather. KC I feel like it was still the right side had Mahomes not been hurt. The Ugly: Giants with one of the worst running offenses against the #1 running offense. We gotta notice this!


On to the conference games. 


San Francisco +2.5

If you wait, we may get it at +3, although the +125 straight up seems like a possibility.

It’s tough betting a “rookie” QB against a team that looked unstoppable last week (recency bias). The #1 running offense with a QB that can scramble. AJ is a huge deep threat that could be unstoppable. Of course, a #1 sack defense that can disrupt this rookie. But here’s why I ended up on the 49ers:

  • Buying the narrative that the defense stops the run and bc Purdy throws mostly short, they won’t get to him as much.

  • All the models are crazily pointing at SF winning by an average of 7!

  • I prefer backing a team that has covered 9 of the last 10 vs a team that has a 9-9 ATS record.

  • Home favorites during the playoffs haven’t done well during the playoffs in the past covering 37% since 2000.

  • SF hasn’t lost since McCaffrey arrived. They have more offensive weapons. Offense wins championships.


The AFC game pick can be found on my Rofkin channel: https://rokfin.com/article/12150/NFL-Point-Spread-Picks--Conference-Championships


NFC Conference Championship - Early Look


SF @ PHI -2.5

  • Injuries: No significant injuries.

  • Money: PHI getting most of the money. Reports vary from 60% to 90% of the money. Plus the line moved from 2.5 for a reason.

  • QB Rating: Slight edge Hurts. Purdy only has 7 games, has about the same TD/INT rate, same QBR rating, but significantly less rushing yards. Hurts will need to rely on the passing game here more than last game. SF run defense is good. Rookie QB keeps winning but will this be the game he breaks or is he a true stud?

  • Offensive Line: Slight edge SF. Overall rank 6th vs 4th. Protecting the QB: adjusted sack rate (asr) for PHI vs SF was 7.7% and 6.3%. SF is slightly better at protecting the QB allowing 31 sacks ranked 10th vs 44 for PHI ranked 20th. 


PHI better opening for short and 2nd field runs ranking about 7th in the league vs SF’s 26th. Open field yards is a different story. SF 4th in the league with its deadly catch and run offense while PHI ranks 19th.

  • Defensive Line: Slight edge PHI. PHI’s defensive line's main strength by far is its pass rush.  As I said last week, PHI is an outlier with 11.2% asr. Their weakness is the short and middle runs but does ok (rank 10th) against open field yards. SF on the other hand, has an average short run d-line, but ranked 1st at 2nd level and open field yards. Their 7.0% asr is average for the league.

    Two scenarios: PHI d-line breaks Purdy with so much rush leading to mistakes. PHI scores enough to cover OR SF d-line stops the run, forcing incomplete passes and the game is low scoring, at the same time Purdy and his short passes hit the target.

  • Offense: Even. Both are top 5 offenses with a slight edge in pass DVOA to SF, but PHI ranks 1st running the ball and SF 13th. 

  • Defense: Slight edge SF. Here’s the matchups for these two top defenses. PHI’s below average run defense is against SF’s #13 running offense. Unfortunately, SF’s top 3 pass offense is facing the #1 passing defense (up 4% points from 2nd place) in the league. PHI’s top rush offense is facing the #1 rush defense (also up 4% points from 2nd place). Last week (red flag) they played one of the worst run offenses in the league (recency bias). PHI’s passing also faces a steep battle in SF’s #5 passing D (half the points of PHI). It’s also worth noting that the below average run D for PHI is facing a team that doesn’t throw long passes.

  • ATS: PHI is 9-9 ATS not covering their previous 5, until last week. SF is at 13-6 ATS and 9-1 in their last 10.

  • Trends: During playoffs since 2000, home team favorites by 2.5 or 3, have gone 12-21 (36%) ATS. Home teams favorites by more than 7 but less than 10 covered 8-9 this season and 50% so no trend during regular season. 

  • Matchups: The last time these two teams played each other was week 2 of last year. Eagles at home favorite by 3 under Jalen Hurts lost 11-17.


Conclusion

To bet on the Eagles, you believe their pass rush is so good that it will disrupt the rookie. SF will try running the ball and it won’t work. When needed to pass, SF’s o-line can’t hold them up. The offense is good enough against this SF defense to score more given the mistakes.  


If you’re betting SF, you’re buying into a great offensive line that could tame the Eagles rush. Purdy continues strong, no mistakes, short passes, and moves the chains. The SF defense contains the run and forces Hurts to pass. Run game doesn’t work and the Eagles are toast.


NFL Machine Learning Picks - Divisional Round

Divisional playoffs have arrived and we’re down to 8 teams. Each of the games' geeky stat comparison can be found here for the NFC and the AFC Divisional Games.

First let me review last week. Smart to stay away from both divisional AFC games that stayed close, even with backup QBs. SF was money but we were sweating in the first half. The Giants was also easy money as their reinforced defense played well and kept the game within reach. Tampa was bad in hindsight. They didn’t pressure the QB, their ATS this year has been horrible, and their one-dimensional passing game didn’t last against Dallas’ tough D.

On to the divisional games. 

Kansas City -8.5

This boiled down to as a bet for one last blowout in the playoffs. Although many think the Jags have been playing well, they didn’t see the Titans game or the first half of the Chargers game. Now they face a defense that started slow but is playing much better.

  • Recipe for a blowout, bad defense 30th ranked against the best passing offense in the league by a lot.
  • Mahomes >>>Lawrence. MVP season for Mahomes.. 
  • KC 3rd in adjusted sack rate can pressure the QB much better than JAX can
  • My only worry is that most of the money is on JAX. Could be a situational play like home favorite by more than a TD doesn’t cover well during playoffs, idk.
  • KC won by 10 on Week 11 despite 3 turnovers by KC and 0 for JAX
  • Going against the models here. Data crunching suggests this game stays closer. 
  • The rest of the divisional picks can be found here.


AFC Divisional Games - Early Look

 JAX @ KC -8.5

  • Injuries: No significant injuries known atm. 

  • Money: 61% of the bets and 51% of the money on KC.

  • QB Rating: Moderate edge to Mahomes. Mahomes is having an MVP season. He’s ranked #1 in almost every category. Finished with 41 TDs + 4 Rushing, 12 INT, 67% CR. Lawrence is ranked about 7th, lower in QBR, and has 25 TDs + 5 Rushing, 7 INT, 67% CR.

  • Offensive Line: Even. Both protect their QBs very well. Ranked 2nd and 3rd in the league with asr of 4.7%. JAX lacks short power runs but is very good on open field. KC ranked better overall because of adjusted line yards but about average on open field rank.

  • Defensive Line: Slight edge KC. Again, JAX’s defensive line ranks much better overall somehow. KC has 8.9% asr vs JAX’s 5.1 ranks 3rd vs 30th in the league. This means it’ll be harder for JAX to put pressure on the QB. Against the run, JAX much better at stopping both power and open field runs.

  • Offense: Moderate edge KC. The #1 overall and passing offense against a JAX offense that ranks 6th on the pass and 20th on the run. Weighted wise, there’s no difference for JAX but an improvement is seen. Also, KC’s weighted DVOA is about 20 percentage points better than JAX’s and about 4 percentage points better than SF’s.

  • Defense: Slight edge KC. KC’s is an average defense that is playing better as of late. They rank 20th against the pass. JAX is 30th at stopping the pass which is about 13 percentage points worse than KC. Overall, KC ranks 14th and JAC 26th.

  • ATS: KC finished the regular season 7-10 ATS (3-5 in last 8) while JAX is at 9-9 ATS, 5-1 in last 6. 

  • Trends: During playoffs since 2000, home team favorites between 7 and 10 have gone 15-25 (37%) ATS. Home teams favorites by more than 7 but less than 10 covered 8-9 this season and 50% so no trend during regular season.  

  • Matchups: Chiefs won by 10 in Week 11 where Mahomes threw 331 yds, 4 TDs, 1INT. The Chiefs fumbled twice. 3 turnovers vs 0 and somehow managed to cover a 9.5 point spread.


Conclusion: You like Jacksonville because KC doesn’t cover big spreads. The team has an offense that can score lots of points and keep up with KC. The sharps money and ATS trends are in your favor. 


You like KC because Mahomes is having an MVP year. The #1 offense against the 30th pass defense stands no chance. KC defense playing better as of late, stops them more times, KC doesn’t even punt and KC covers just as it did in Week 11.


For the CIN @ BUF Early look, click below.


NFC Divisional Games - Early Look

 NYG @ PHI -7.5

  • Injuries: PHI rested one week which should benefit Hurts to fully recover and use his ground game this week. NYG has Jackson and McKinney healthy who weren’t there in their first matchup in Week 15.

  • Money: NYG getting 60% of the bets and 70% of the money.

  • QB Rating: Moderate edge Hurts. Hurts dominates the stats on both run and passing against Jones. 13 rushing TDs vs 7, 760 yars vs 705. On the air 3500 vs 2900 yards, 22 TDs vs 15, and 6 vs 5 INTs.

  • Offensive Line: Slight edge PHI. Overall rank 6th vs 24th. Passing: adjusted sack rate (asr) for PHI vs NYG was 7.7% and 8.4% 17th and 24th ranked in the league respectively. PHI defends their QB slightly better but both are below average. Opening for the run, both were very good. NYG is better at short runs and power but PHI ranks better in 2nd level and open field. 

  • Defensive Line: Slight edge PHI. Overall they are neither good mostly because of their protecting the run. PHI ranked last in power runs while NYG ranks 26th. Open field wise, PHI is top 10 and NYG still bottom 5. Against the pass, PHI is an outlier with 11.2% asr and 70 sacks, first in the league. NYG have 41 sacks and 6.7% asr rank 22nd (no sacks last week).

  • Offense: Slight edge PHI. Both are top 10 offenses with similar pass DVOA but PHI ranks 1st running the ball and the Giants 7th. Weighted DVOA, given Hurts didn’t play two games, puts these two offenses much closer together.

  • Defense: Slight edge PHI. Overall, PHI is better ranked. PHI is very good against the pass (partly bc asr). They do rank 21st against the run. The Giants are bottom 5 DVOA with the worst DVOA against the run. 

  • ATS: PHI finished the regular season 8-9 ATS not covering their last 5. NYG finished at 14-4 ATS having covered their last 5 but note that their last non-cover was against the Eagles in Week 15.

  • Trends: During playoffs since 2000, home team favorites between 7 and 10 have gone 15-25 (37%) ATS. Home teams favorites by more than 7 but less than 10 covered 8-9 this season and 50% so no trend during regular season. 

  • Matchups: PHI beat NYG by 16 and ran for over 250 yards in Week 15 covering a 7 point spread. Then in Week 18 with NYG benched starters and PHI playing conservatively PHI won by 6 not covering a 17 point spread.


Conclusion: To bet on the Giants, you need to believe that their defense is much better than the numbers reflect with all their players healthy. The offenses ranked similarly but the Giants will be able to do damage on the ground and run the clock. Sharps, trends and ATS are also in your favor.

To be on the Eagles, you know Hurts can hurt you badly on both the ground and in the air. AJ Brown will be a lethal threat that could open up the game making the Giants pass more. You also like the outlier in sacks and know that Daniel Jones will have a lot less time to get rid of the ball.


The Dallas vs SF analysis can be found here.


NFC Wildcard Games Analytic Comparison

 I wrote this format for all the wildcard games. You can find them on my channel. Here's what I wrote about the first wildcard game:

SEA @ SF -10

  • Injuries: Deebo back. No significant injuries known atm.

  • Money: 64% of the bets and 70% of the money on SF.

  • QB Rating: Even. Purdy has a better TD to INT ratio including the 2 TDs 0 INT against SEA in Week 15 and hence a slightly better QBR. Both QBs are new to the playoffs but Purdy is the rookie.

  • Offensive Line: Big edge SF. The offensive lines ranked 4th vs 30th in the league. SEA has allowed 15 more sacks and an adjusted sack rate of 8.9% vs 6.3% for SF. SEA slightly better at open field yards (ofy), but not far from SF which is probably not better when only including games McCaffrey has played.

  • Defensive Line: Moderate edge SF. Although both defensive lines have similar sacks and adjusted sack rates, SF does a much better job against the run. SEA ranks 24th in open field yards which measures effectiveness of stopping long runs. A good recipe for McCaffrey. SF ranks 1st in ofy.

  • Offense: Slight edge SF. SEA is trending the wrong way on offense scoring less than 20 points in 3 of their last 4 games. SF has scored more than 30 in 5 of their last 6. 3rd vs 8th rank on pass, but SEA is 24th in running and SF top 10 since McCaffrey trade.

  • Defense: Big edge SF. The #1 defense against the 21st. SEA ranks 25th at stopping the run and just average at stopping the pass while SF ranks 2nd and 5th respectively.

  • ATS: SF finished the regular season 11-6 ATS and 7-1 in their last 8. SEA finished at 7-10 ATS but 1-7 in their last 8. 

  • Trends: Home teams by more than 10 finished the season 10-13 ATS but has hit 46-31 (60%) since 2019. Since 2000, during the playoffs, home teams favorite by 10 or more are 14-3 (82%) ATS. 

  • Matchups: SF beat SEA twice this season covering both games as favorites by 8.5 and 3 in Weeks 2 and 15 respectively.


AFC Wildcard Games Analytic Comparison

I wrote this format for all the wildcard games. You can find them on my channel. Here's what I wrote about the first wildcard game?

SEA @ SF -10

  • Injuries: No significant injuries known atm.

  • Money: 64% of the bets and 70% of the money on SF.

  • QB Rating: Even. Purdy has a better TD to INT ratio including the 2 TDs 0 INT against SEA in Week 15 and hence a slightly better QBR. Both QBs are new to the playoffs but Purdy is the rookie.

  • Offensive Line: Big edge SF. The offensive lines ranked 4th vs 30th in the league. SEA has allowed 15 more sacks and an adjusted sack rate of 8.9% vs 6.3% for SF. SEA slightly better at open field yards (ofy), but not far from SF which is probably not better when only including games McCaffrey has played.

  • Defensive Line: Moderate edge SF. Although both defensive lines have similar sacks and adjusted sack rates, SF does a much better job against the run. SEA ranks 24th in open field yards which measures effectiveness of stopping long runs. A good recipe for McCaffrey. SF ranks 1st in ofy.

  • Offense: Slight edge SF. SEA is trending the wrong way on offense scoring less than 20 points in 3 of their last 4 games. SF has scored more than 30 in 5 of their last 6. 3rd vs 8th rank on pass, but SEA is 24th in running and SF top 10 since McCaffrey trade.

  • Defense: Big edge SF. The #1 defense against the 21st. SEA ranks 25th at stopping the run and just average at stopping the pass while SF ranks 2nd and 5th respectively.

  • ATS: SF finished the regular season 11-6 ATS and 7-1 in their last 8. SEA finished at 7-10 ATS but 1-7 in their last 8. 

  • Trends: Home teams by more than 10 finished the season 10-13 ATS but has hit 46-31 (60%) since 2019. Since 2000, during the playoffs, home teams favorite by 10 or more are 14-3 (82%) ATS. 

  • Matchups: SF beat SEA twice this season covering both games as favorites by 8.5 and 3 in Weeks 2 and 15 respectively.

See the two other games here. Picks coming after.